I thought I’d do something a bit different today. Instead of writing about what’s happened, I’m going to discuss what’s setting up tonight.
It’s currently 11:50am and at the time of writing, we have 3 potential trades setting up for this evening. It is important to note that technical indicators are not set until a particular candlestick closes. In other words, if a candlestick is still live, its dimensions are still subject to change, which means that the indicators based on those dimensions can also still change, which means that signals can still change. So please DO NOT action anything based on this article as any trades will not be confirmed for quite a few hours.
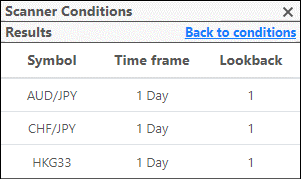
BUT, it can give you a good guide into what we and our members look for when trading. Here are the 3 opportunities, and I will review the AUD/JPY and HKG33 trades below.
AUDJPY is setting up as a BUY trade.
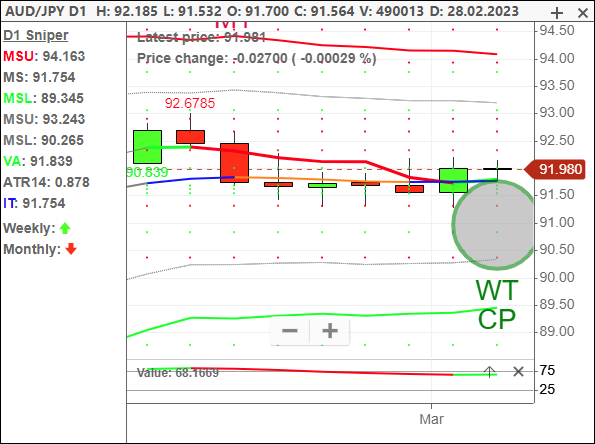
The price is starting to rise following a recent correction and now moving back inline with an ascending Daily Trend (Blue line), Weekly Trend (WT) and ascending Chart Pattern (CP). So technically it looks good. Beyond this however, there are a couple of points of note. Whilst I quite like the setup, the past 6 days have been more sideways than anything, almost generating a buy by default rather than a result of strong ascending price movement. As a consequence, and by running the Trade Mate tool, we can see a stop loss of only 24 points. Historical data proves that trades with a stop loss of less than 40 pips are more likely to result in a loss than a win. Why would this be? 2 reasons. Firstly, a narrow stop demonstrates a lack of momentum into the trades, in the case of a buy/long trade, often with a weak entry candlestick (i.e. a doji or red candlestick instead of big and green one), suggesting sideways or negative movement into the trade. For any golfers out there, rather like decelerating into the ball rather than accelerating into impact. And secondly, just not enough room for a trade to breathe. Any market will have a certain amount of random oscillation that takes place from general buying or selling. Yes, it might follow a trend, but within that it must ebb and flow as traders and investors need to buy and sell. If we don’t give it enough space to ebb and flow then we can have the irritating scenario where we call the trade correctly and still lose money.
Experience suggests that, and especially for new Trendsignal traders, we should avoid such trades. Therefore, unless we can see some real positive momentum into tonight’s close, we shall not be taking this trade.
The HKG33 by contrast shows a different story.
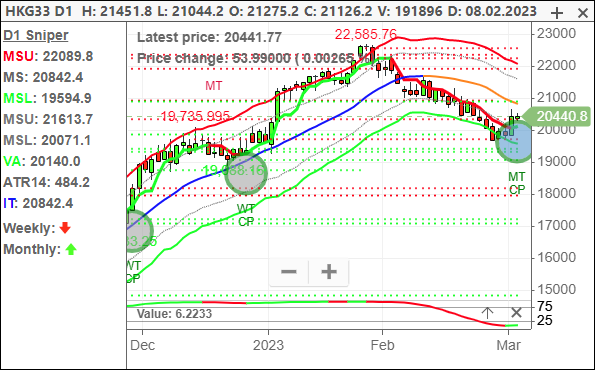
Recent price movement has been rotating smoothly on the Hang Seng index. February’s large falls have now hit 19735, being December’s key area of resistance, so it is nice to see a positive reaction off that level. Regardless, we have a buy Sniper trade setting up, as the index rotates back higher, inline with its Monthly Trend (CT), ascending Chart Pattern (MT) and from an oversold position. These are hallmarks of an attractive trade setup, hence the Sniper disk appearing on today’s candlestick. With no obvious obstacles between currency prices and 22585, it is looking like an attractive Long trade and one our members will be reviewing tonight, with the help of Trade Mate.
In summary, the Sniper strategy identifies the core trades, but some simple chart reading can help to identify additional risk, smooth results and even help to outperform the strategy model.
All the best
Adrian Buthee
Director


