Candlestick patterns have long been a staple in the toolkit of traders and analysts, offering a visual representation of price movements in financial markets.
Originating in Japan, these patterns have evolved into a widely used tool for technical analysis. In this guide, we will demystify candlestick patterns, providing insights into their basics, common patterns, and how to effectively use them in your trading strategy.
Understanding Candlestick Basics: To grasp the power of candlestick patterns, it's essential to first understand their basic anatomy. A candlestick consists of a body, upper and lower wick, and colour.
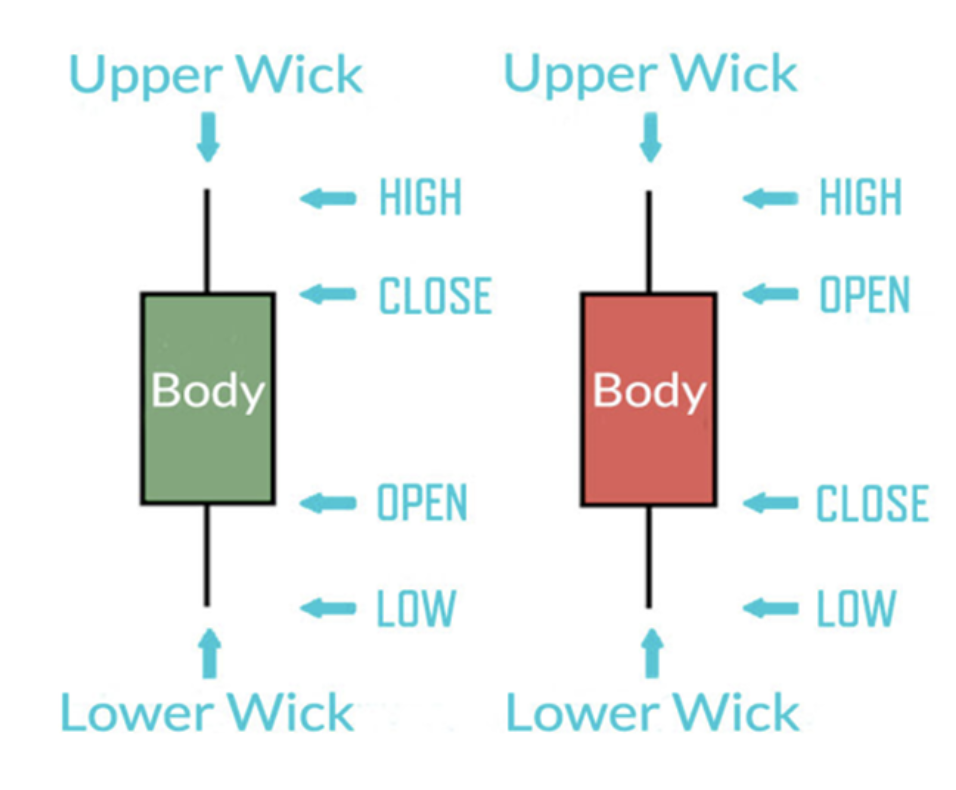
The body represents the opening and closing prices, while the wick indicates the high and low prices during the trading period. Colours, typically green or red, signify whether the closing price was higher or lower than the opening price. So, if you see a GREEN candle on your chart, you know price went up during that period, and if RED, price went down. This foundational knowledge lays the groundwork for interpreting more complex candlestick patterns.
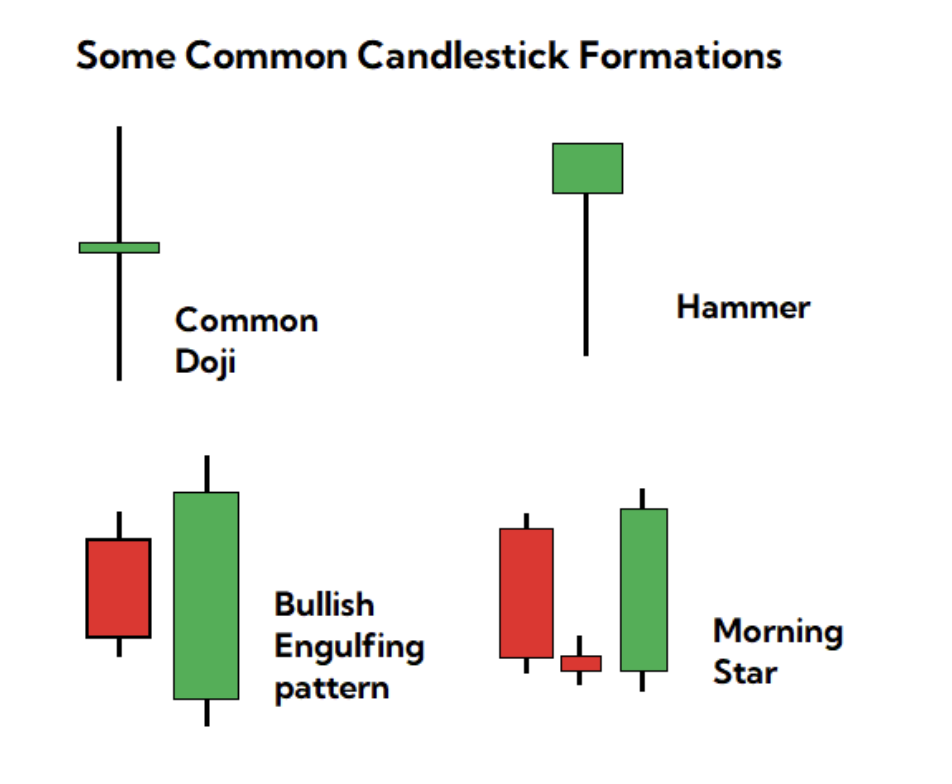
Common Candlestick Patterns: Several key candlestick patterns serve as valuable indicators for traders. The Doji, for example, signals market indecision with its small body and equal opening and closing prices. The Hammer, with its long wick, suggests potential trend reversal, often seen at the bottom of a downtrend. Engulfing patterns, where one candle engulfs the previous one, indicate a potential reversal of the prevailing trend. Morning and Evening Star patterns offer insights into potential bullish or bearish reversals, respectively. It's crucial to note that while these patterns provide valuable information, their effectiveness is heightened when used in conjunction with other technical indicators.
Recognising Reversal and Continuation Patterns: Distinguishing between reversal and continuation patterns is key for making informed trading decisions. Reversal patterns, such as the Evening Star, may indicate an impending shift in trend direction. On the other hand, continuation patterns like Flags or Pennants – which are made up of groups of candlesticks – suggest that the existing trend is likely to persist. Traders must be adept at recognising these patterns and understanding their implications in the broader market context.
Back testing and Validation: Before fully incorporating candlestick patterns into a trading strategy, it's crucial to back test them on historical data. This process helps validate the effectiveness of these patterns in different market conditions. However, it's essential to remember that while candlestick patterns offer valuable insights, they should not be the sole basis for trading decisions. Combining them with other technical analysis tools can enhance accuracy and mitigate risks associated with relying solely on one type of indicator.
Conclusion: In conclusion, candlestick patterns are powerful tools for traders seeking to understand market sentiment and make informed decisions. However, they are not infallible, and risk management remains paramount. By grasping the basics, recognising common patterns, and understanding the distinction between reversal and continuation signals, traders can integrate candlestick patterns effectively into their broader technical analysis strategy. Remember to practice in a simulated environment before applying these techniques in live markets, and always stay informed about the dynamic nature of financial markets.
To find out more about the trading courses and strategies we’ve created over the past 20 years to help traders identify high-probability trades without the need to study chart patterns, to manage their risk and to profit from markets, join us in one of our free live sessions.
Register for your FREE session by clicking here.


